The NZDUSD pair got hit once again by negative tariffs comments supporting the greenback across the board. What’s next?
Fundamental Overview
The USD got boosted once again by negative tariffs news yesterday as Bessent talked about universal tariffs starting at 2.5% and gradually increasing by the same amount every month, which eventually could reach 20%. Trump later doubled down on that saying that he wants tariffs much bigger than 2.5%.
The tariffs risk has been the only thing keeping a bid under the US Dollar after the US inflation data marked the top in the repricing of rate cuts expectations. So, when this risk eases, the greenback weakens and vice versa. Today, we have the FOMC decision where the central bank is expected to keep rates steady. If Fed Chair Powell sounds more dovish, we could see the greenback weakening again.
On the NZD side, the New Zealand Q4 CPI report last week came in slightly below expectations although it didn’t change much in terms of market pricing. As a reminder, the RBNZ cut interest rates by 50 bps as expected at the last meeting. The market is pricing a 60% chance of a 25 bps cut in February and a total of 105 bps of easing by year end.

New Zealand Q4 2024 CPI slightly higher than expected
- +0.5% q/q (expected +0.5%) and +2.2% y/y (expected +2.1%)
New Zealand CPI (Q/Q) Q4:
0.5% q/q is inline with the consensus expectation adl a little lower than Q3
- expected 0.5%, prior 0.6%
2.2% y/y is a little higher than was expected and is unchanged from Q3
- expected 2.1%, prior 2.2%
Tradeable +0.3% q/q jumped above estimates and last quarter
- expected 0.1%, prior -0.2%
Non-Tradeables +0.7% have come in under median estimates and down from Q3 – the RBNZ will take encouragement from this.
- expected 0.8%, prior +1.3%
“Tradable” and “Non-tradable” inflation are terms used to describe different aspects of inflation based on the nature of the goods and services involved.
- Tradable Inflation:
- Definition: Tradable inflation refers to inflation in goods and services that are traded internationally.
- Examples: Commodities like oil, metals, agricultural products, and manufactured goods like electronics and automobiles.
- Characteristics: Prices of tradable goods are often influenced by global market conditions, exchange rates, and international supply and demand dynamics. For instance, if the price of oil increases globally, it will lead to tradable inflation in countries that import oil.
- Impact: The inflation of tradable goods can be significant for countries that rely heavily on imports or exports. Changes in exchange rates can also have a substantial impact on tradable inflation.
- Non-tradable Inflation:
- Definition: Non-tradable inflation refers to inflation in goods and services that are not internationally traded.
- Examples: Services like healthcare, education, and local utilities, as well as goods with high transportation costs relative to their value, or those that are typically consumed where they are produced.
- Characteristics: Prices of non-tradable goods and services are primarily influenced by domestic factors such as local wage levels, property rents, and domestic policies. These prices tend to be more stable compared to tradable goods, but can vary significantly from country to country.
- Impact: Non-tradable inflation is more directly controlled by domestic monetary and fiscal policies. It is less subject to external shocks but can be influenced by domestic factors like labor market conditions and local regulatory changes.
In summary, tradable inflation is primarily driven by international factors and market conditions, whereas non-tradable inflation is driven by domestic economic conditions and policies.
Daily Timeframe
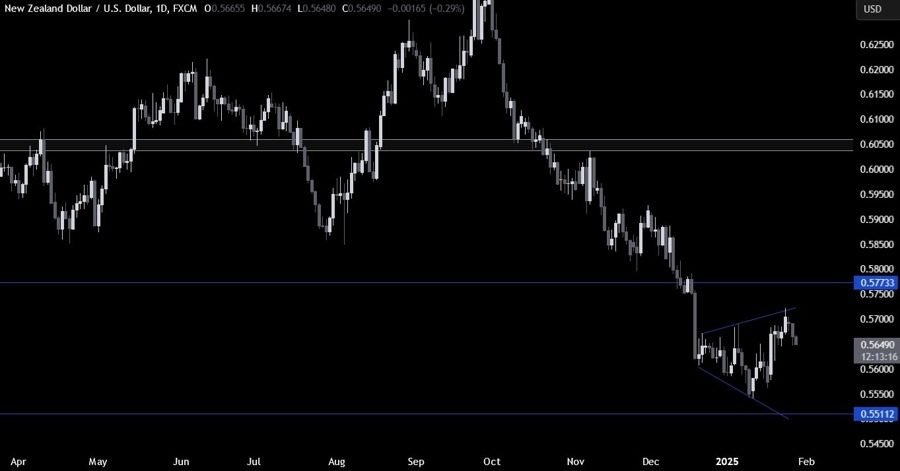
On the daily chart, we can see that NZD/USD seems to be making a broadening wedge at the lows. This is generally a continuation pattern, so a break below the 0.55 handle could see the sellers’ becoming aggressive again. The buyers, on the other hand, will likely step in around the lows to position for a rally into the 0.57 handle with a better risk to reward setup.

4H Timeframe
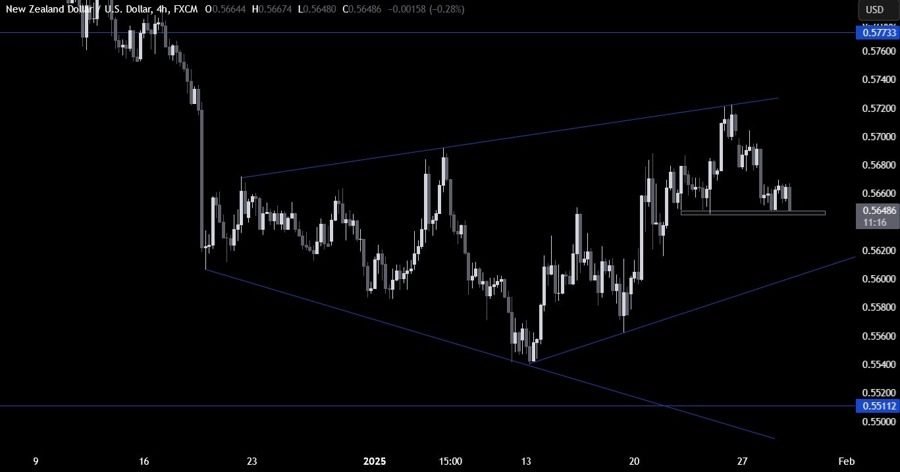
On the 4 hour chart, we can see that we have a support zone around the 0.5650 level. The buyers will likely step in here with a defined risk below the level to position for a rally into new highs. The sellers, on the other hand, will look for a break lower to increase the bearish bets into the trendline around the 0.5620 level.

1H Timeframe
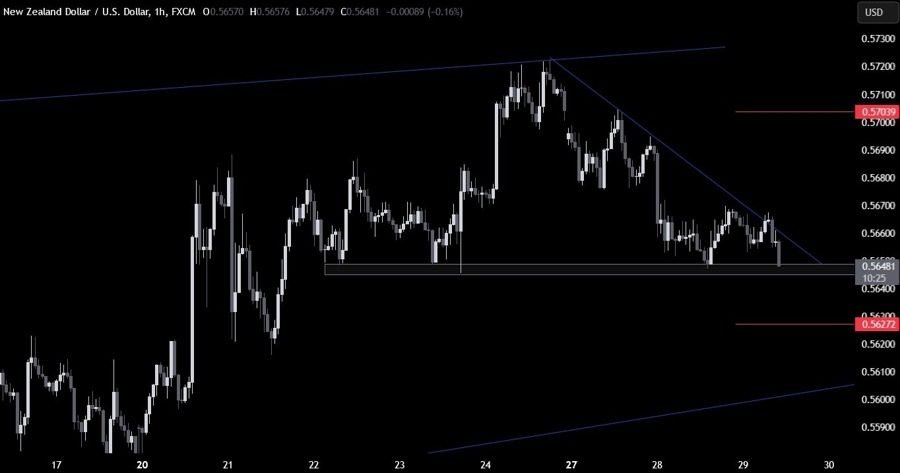
On the 1 hour chart, we can see we have a downward trendline defining the current bearish momentum on this timeframe. The sellers will continue to lean on it to keep pushing into new lows, while the buyers will look for a break higher to increase the bullish bets into new highs. The red lines define the average daily range for today.

Upcoming Catalysts
Later today we have the FOMC Policy Decision. Tomorrow, we get the US Q4 GDP report and the latest US Jobless Claims figures. On Friday, we conclude the week with the US PCE and the US Employment Cost Index.

