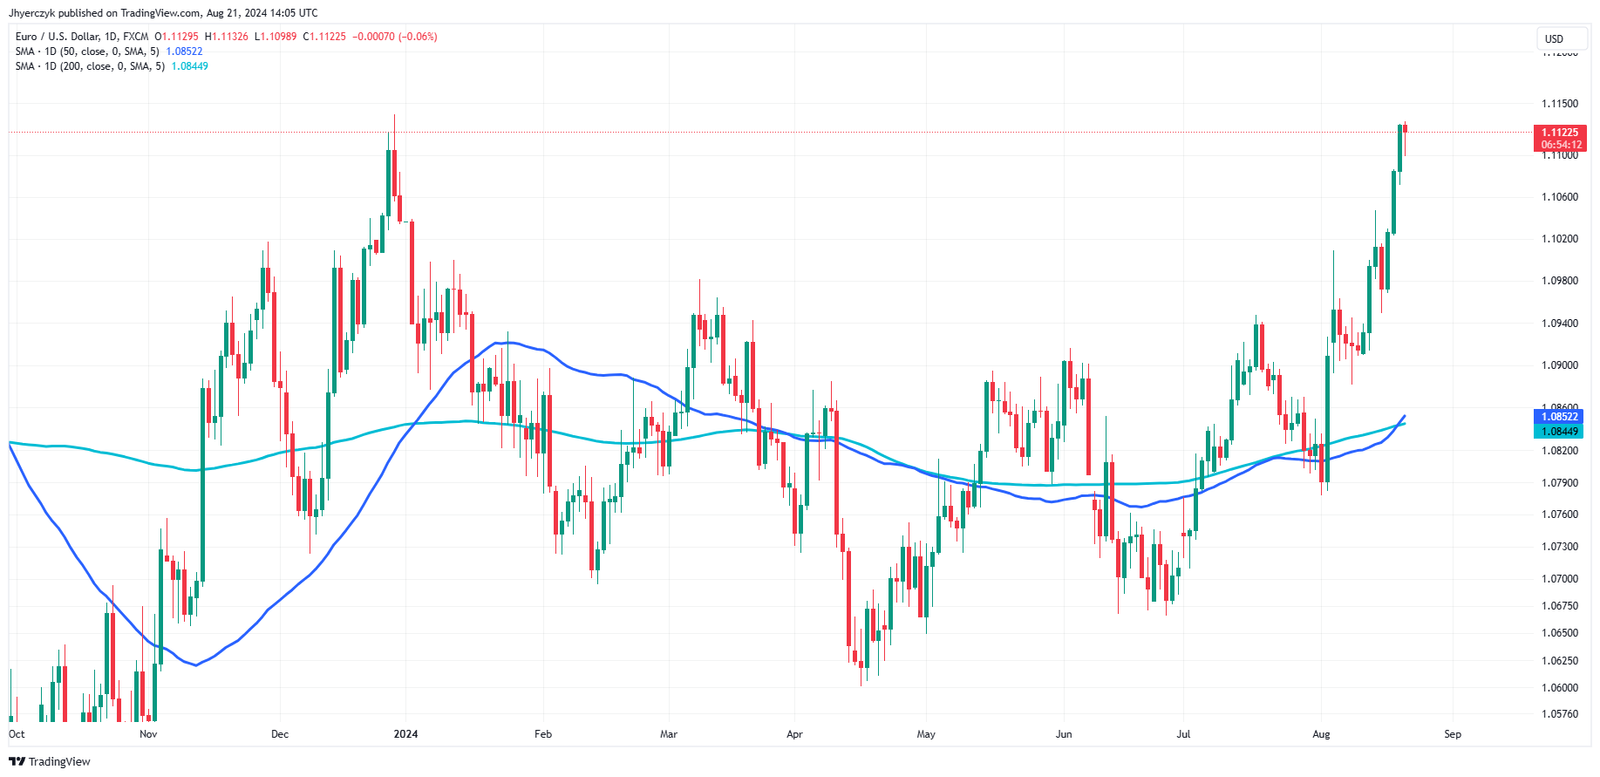
Welcome back to my daily blog on forex day trading! In the last few posts, we’ve covered the basics of getting started, common mistakes to avoid, and beginner-friendly trading strategies. Today, we’ll tackle a fundamental skill every trader must master: how to read forex charts.
Forex charts are the backbone of technical analysis. They provide a visual representation of price movements, helping you identify trends, patterns, and potential trading opportunities. But for beginners, charts can seem overwhelming. Don’t worry—by the end of this article, you’ll know how to read forex charts like a pro.
What Are Forex Charts?
Forex charts display the price movements of currency pairs over time. They are essential for:
- Identifying Trends: Is the market moving up, down, or sideways?
- Spotting Patterns: Are there recurring formations that signal potential reversals or continuations?
- Timing Entries and Exits: When is the best time to buy or sell?

Types of Forex Charts
There are three main types of charts, each with its own advantages:
1. Line Charts
- What It Shows: A simple line connecting closing prices over a period.
- Best For: Getting a quick overview of price trends.
- Example: A line chart of EUR/USD shows the overall direction of the pair over the past month.
2. Bar Charts
- What It Shows: Each bar represents a specific time period (e.g., 1 hour, 1 day) and displays the open, high, low, and close prices.
- Best For: Analyzing price ranges and volatility.
- Example: A bar chart of GBP/USD shows the price range for each day, helping you spot key levels.
3. Candlestick Charts
- What It Shows: Similar to bar charts, but with a more visual representation. Each candlestick shows the open, high, low, and close prices, with a “body” and “wicks.”
- Best For: Identifying patterns and market sentiment.
- Example: A candlestick chart of USD/JPY shows bullish (green/white) and bearish (red/black) candles, helping you spot reversals.
Key Elements of a Forex Chart
1. Timeframes
- What It Is: The period each candle or bar represents (e.g., 1 minute, 1 hour, 1 day).
- Why It Matters: Different timeframes suit different trading styles.
- Scalpers: Use 1-minute or 5-minute charts.
- Day Traders: Use 15-minute or 1-hour charts.
- Swing Traders: Use 4-hour or daily charts.
2. Price Axis
- What It Is: The vertical axis showing the price levels.
- Why It Matters: Helps you identify key support/resistance levels and measure price movements.
3. Time Axis
- What It Is: The horizontal axis showing the time period.
- Why It Matters: Helps you analyze price movements over time.
How to Read Candlestick Charts
Candlestick charts are the most popular among traders because they provide a wealth of information in a single candle. Here’s how to read them:
1. Candlestick Anatomy
- Body: Represents the open and close prices.
- Bullish Candle (Green/White): Close > Open.
- Bearish Candle (Red/Black): Close < Open.
- Wicks (or Shadows): Represent the high and low prices during the candle’s timeframe.
2. Common Candlestick Patterns
- Doji: Indicates indecision (open = close). Often signals a potential reversal.
- Hammer: A bullish reversal pattern with a small body and long lower wick.
- Shooting Star: A bearish reversal pattern with a small body and long upper wick.
- Engulfing Pattern: A two-candle pattern where the second candle “engulfs” the first, signaling a reversal.
Example: On the EUR/USD chart, a hammer forms after a downtrend, signaling a potential reversal to the upside.

How to Identify Trends
Trends are the foundation of trading. Here’s how to spot them:
1. Uptrend
- What It Looks Like: Higher highs and higher lows.
- How to Trade: Look for buying opportunities (e.g., buy at support levels).
2. Downtrend
- What It Looks Like: Lower highs and lower lows.
- How to Trade: Look for selling opportunities (e.g., sell at resistance levels).
3. Sideways (Range-Bound) Market
- What It Looks Like: Price moves within a horizontal range.
- How to Trade: Buy at support, sell at resistance.
How to Use Indicators on Charts
Indicators are tools that help you analyze price movements. Here are a few popular ones:
1. Moving Averages
- What It Does: Smooths out price data to show trends.
- How to Use: Look for crossovers (e.g., 50-period crossing above 200-period = bullish trend).
2. RSI (Relative Strength Index)
- What It Does: Measures overbought (>70) or oversold (<30) conditions.
- How to Use: Fade extremes in range-bound markets.
3. Bollinger Bands
- What It Does: Shows volatility and potential breakout points.
- How to Use: Buy near the lower band in uptrends; sell near the upper band in downtrends.
Tips for Reading Forex Charts Like a Pro
- Start with Higher Timeframes: Daily or 4-hour charts provide a clearer picture of the trend.
- Use Multiple Timeframes: Analyze the trend on a higher timeframe and time entries on a lower one.
- Keep It Simple: Avoid cluttering your chart with too many indicators.
- Practice, Practice, Practice: The more you study charts, the better you’ll get at spotting opportunities.
Charts Are Your Best Friend
Reading forex charts is a skill that takes time to master, but it’s one of the most valuable tools in your trading arsenal. By understanding the basics of chart types, candlestick patterns, and trends, you’ll be well on your way to making informed trading decisions.
Action Plan for Beginners:
- Open a demo account and practice reading charts.
- Focus on one chart type (e.g., candlestick) and one timeframe (e.g., 1-hour).
- Learn to identify trends and key levels (support/resistance).
- Add one indicator (e.g., moving averages) to your chart and see how it works.
Learn how to read forex charts like a pro—master candlestick patterns, trends, and key levels to make informed trading decisions.
